Filter by AI or human visitors
Filter your analytics data by traffic source to analyze AI agent traffic separately from human visitors.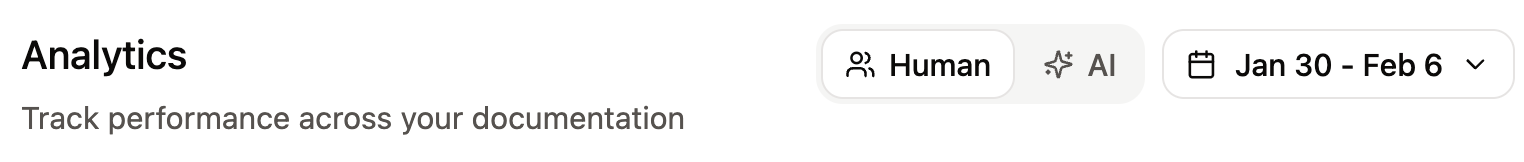

Filter time period
Use the range selector to adjust the time period for displayed data.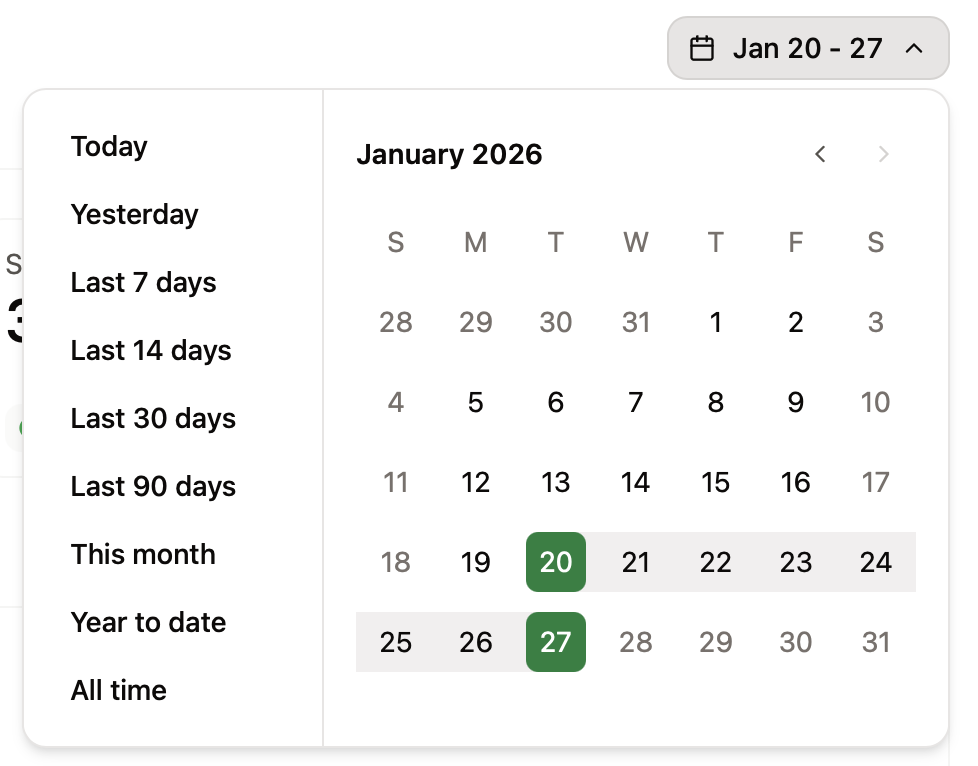
Visitors
The visitors tab displays a bar chart of visitors over time, a list of popular pages, and referral sources. Review your visitors analytics to:- Monitor traffic trends: Observe changes in traffic after updates or new content to understand the impact of your changes.
- Identify popular pages: Use popular pages to understand what content is most important to your users so that you can make sure it is up to date and comprehensive.
- Track traffic sources: Understand where your users are coming from to help you optimize your content for the right audience.
Top agents
When viewing AI traffic, top agents replaces referrals in the visitors tab. Top agents shows which AI agents are visiting your documentation. Use this information to help determine:- AI agent distribution: See which AI platforms are accessing your docs to learn which tools your users prefer.
- Integration opportunities: Identify which AI platforms to prioritize for optimization and testing.
- AI traffic patterns: Monitor which agents are most active and how their usage changes over time.
Views
The views tab displays a bar chart of page views over time and a list of your top pages by view count. Review your page views analytics to:- Monitor content engagement: Track total page views to understand overall documentation usage and identify trends.
- Identify top pages: See which pages receive the most views to prioritize updates and ensure high-traffic content stays accurate.
Assistant
The assistant tab displays a bar chart of assistant usage over time, a list of categories, and chat history. Review your assistant analytics to:- Monitor assistant usage: Observe changes in assistant usage to understand how your users engage with your content.
- Identify frequent categories: Use high occurrence categories to understand what topics are most important to your users. Identify gaps in coverage and prioritize content updates.
- Review chat history: Get detailed high intent data about how your users think about your product by reviewing their chat history with the assistant. See what terms they use, what they need help with, and what tasks they try to accomplish.
Categories
The categories tab uses LLMs to automatically group conversations by topic or theme.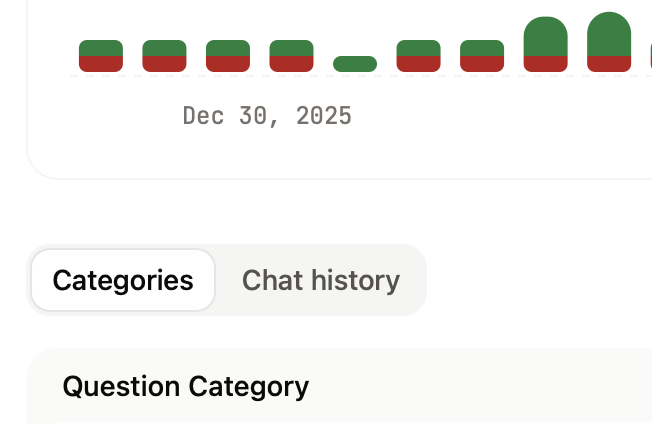
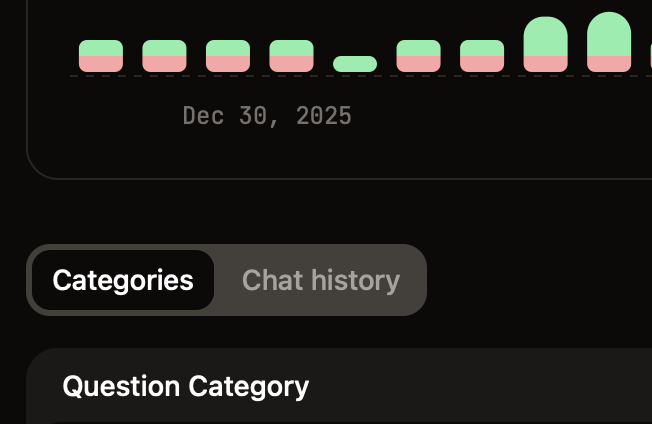
Chat history
The chat history tab displays chronological records of all assistant conversations. Click any message to view the complete chat thread, including the user’s question, the assistant’s response, and any sources cited.Searches
The Searches metric is only available when viewing human traffic.
- Monitor search trends: Observe changes in search queries to understand how your users are finding your content and what topics they want information on.
- Identify frequent queries: Use frequent queries to understand what topics are most important to your users. Identify gaps in coverage and prioritize content updates.
- Identify low click through rates: Click through rates (CTR) show how many users click a search result after typing in a query. Low CTR can indicate that the search results are not relevant to users’ queries. If you have frequent search terms with low CTR, consider improving the relevance of search results by adding keywords and updating your content.
MCP searches
The MCP Searches metric is only available when viewing AI traffic.
- Monitor AI search activity: Track how frequently AI agents search your documentation and identify trends in AI-driven queries.
- Identify common AI queries: Understand what information AI agents are looking for to optimize your content for AI consumption.
- Improve AI discoverability: Use frequent MCP search queries to identify gaps in your documentation that AI agents struggle to find answers for.
Feedback
The feedback tab displays a bar chart of feedback over time and specific feedback items. See Feedback for more information on using feedback data to improve your content.Export analytics
Export any analytics tab to CSV for deeper analysis, reporting, or archival. Exports respect the current traffic source and time range filters.- Navigate to the analytics page of your dashboard.
- Select the tab you want to export.
- Optionally, adjust the traffic source and time range to narrow down the data you want to export.
- Click Export to CSV.
- Mintlify sends you an email with a download link when the export is ready.
Assistant exports
Assistant exports include the queries, responses, sources, and aresolutionStatus column that indicates whether the assistant successfully answered each question (answered or unanswered). Use the resolutionStatus column to identify documentation gaps surfaced by questions the assistant could not resolve.